
![double-checking-nasa’s-eclipse-estimate-at-home-[hackaday]](https://i0.wp.com/upmytech.com/wp-content/uploads/2024/04/177840-double-checking-nasas-eclipse-estimate-at-home-hackaday.png?resize=800%2C445&ssl=1)
Double-Checking NASA’s Eclipse Estimate at Home [Hackaday]
If you were lucky enough to be near the path of totality, and didn’t have your view obscured by clouds, yesterday’s eclipse provided some very memorable views. But you know what’s even better than making memories? Having cold hard data to back it up.
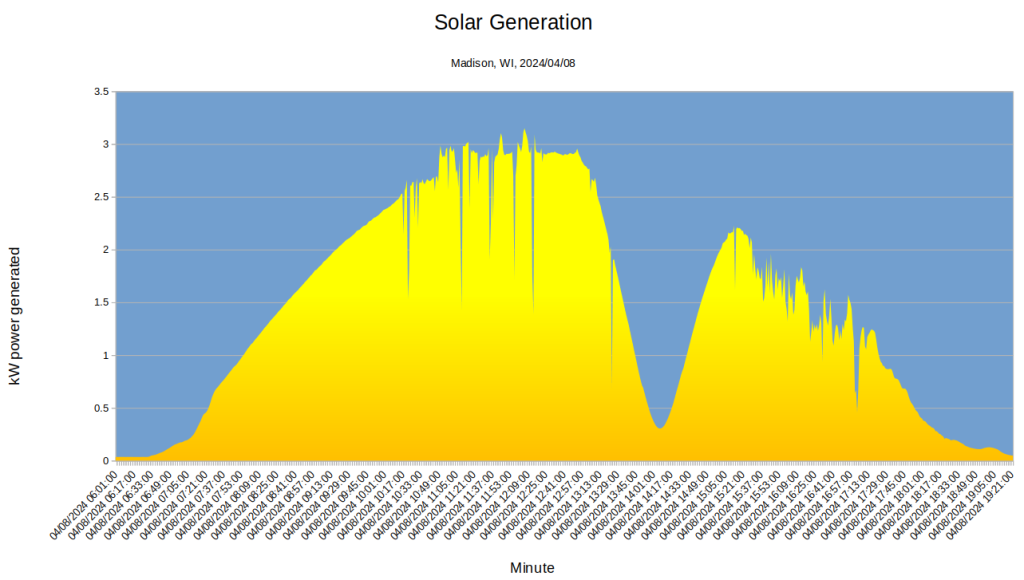
A graph of the system’s generated power shows a very clear dip during the duration of the eclipse, which let him determine exactly when the occlusion started, peaked, and ended.
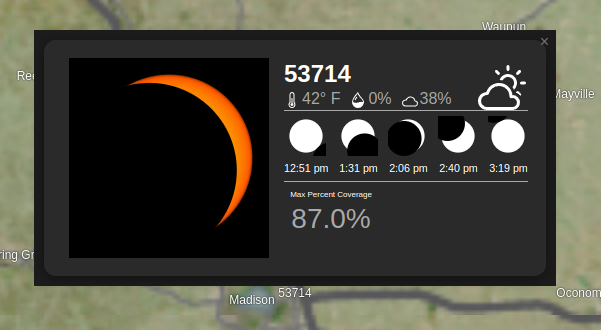
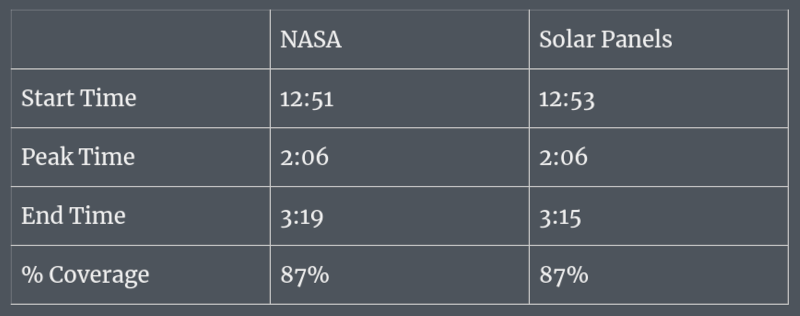
What’s more, by comparing the output of the panels at their lowest with the pre-eclipse peak, [Bob] was able to calculate that the light falling on them dropped by roughly 87 to 90% — right where NASA pegged it. Similarly, the timing of the eclipse as experienced by his solar system lined up within a few minutes of what the website predicted.
That the world’s leading space agency was able to properly model one of the biggest celestial events in recent memory is perhaps not overly surprising. That’s part of what we’re paying them for, honestly. But it’s always good to run a second set of eyes over the numbers.