
![bode-plot-un-lecture-[hackaday]](https://i0.wp.com/upmytech.com/wp-content/uploads/2023/03/113488-bode-plot-un-lecture-hackaday.png?resize=800%2C445&ssl=1)
Bode Plot Un-Lecture [Hackaday]
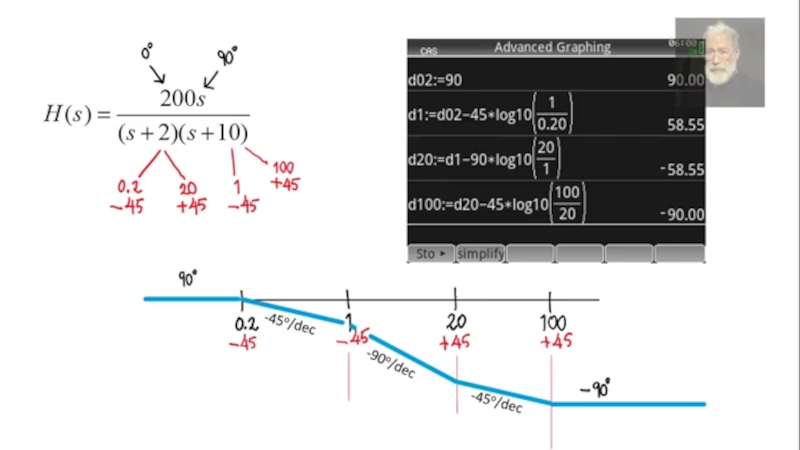
[Rolinychupetin] insists that his recent video is not a lecture but actually a “recitation” about Bode plots. That may be, but it is still worth a watch if you want to learn more about the topic. You can see the video below.
If you haven’t run into Bode plots before, they are simple plots of magnitude or phase vs. frequency, usually plotted on a log scale. Named after Bell Lab’s [Hendrik Wade Bode], they are useful for understanding filters or anything with a frequency response.
Of particular interest are the zeros and poles of the graph. Simplistically, you can think of these as the dips and peaks of the response curve. The math is a bit more complicated than that, but you can learn more in the video.
Of course, these days, we are more likely to see a Bode plot from a simulation tool or test instrument than plot them by hand, but it is good to understand what’s going on. As you might expect, if you can generate a frequency sweep, it isn’t that hard to display a Bode plot on an oscilloscope. Or just use a network analyzer.